Couple using tablet to view doorbell camera

Part 5: What the people want

Where consumers think tech could work harder—and smarter.

Family before anything else

Family and the household—those are the top reasons people cite for wanting more tech. Whether it’s for “keeping the home and loved ones safe” (chosen by 48% of respondents) or keeping them “comfortable” (41%), family always came first. Other reasons include:

Bat and ball icon. Hobbies caption
Piggy bank icon. Finances caption
Banana icon. Health caption
Computer monitor icon. Career caption
Phone icon. Communication caption
Apple on books icon. Education caption

The way people need tech now

Three boys looking at a cellphone while sitting and laying on a bed

Generational differences

Members of Gen Z have a greater need for tech in many areas of their lives, including mental health, personal interests and hobbies (50% vs. 39% of everyone else), home life (45% vs. 38%); communicating and relationships (38% vs. 24%); and education (31% vs. 20%).

Little girl high fives her dad in the kitchen

Regional differences

People in the South rely heavily on tech when it comes to keeping their household and loved ones safe (56% vs. 48% for all consumers). Those living in the West are more focused on maintaining and improving their mental health (34% vs. 27% for everyone else).
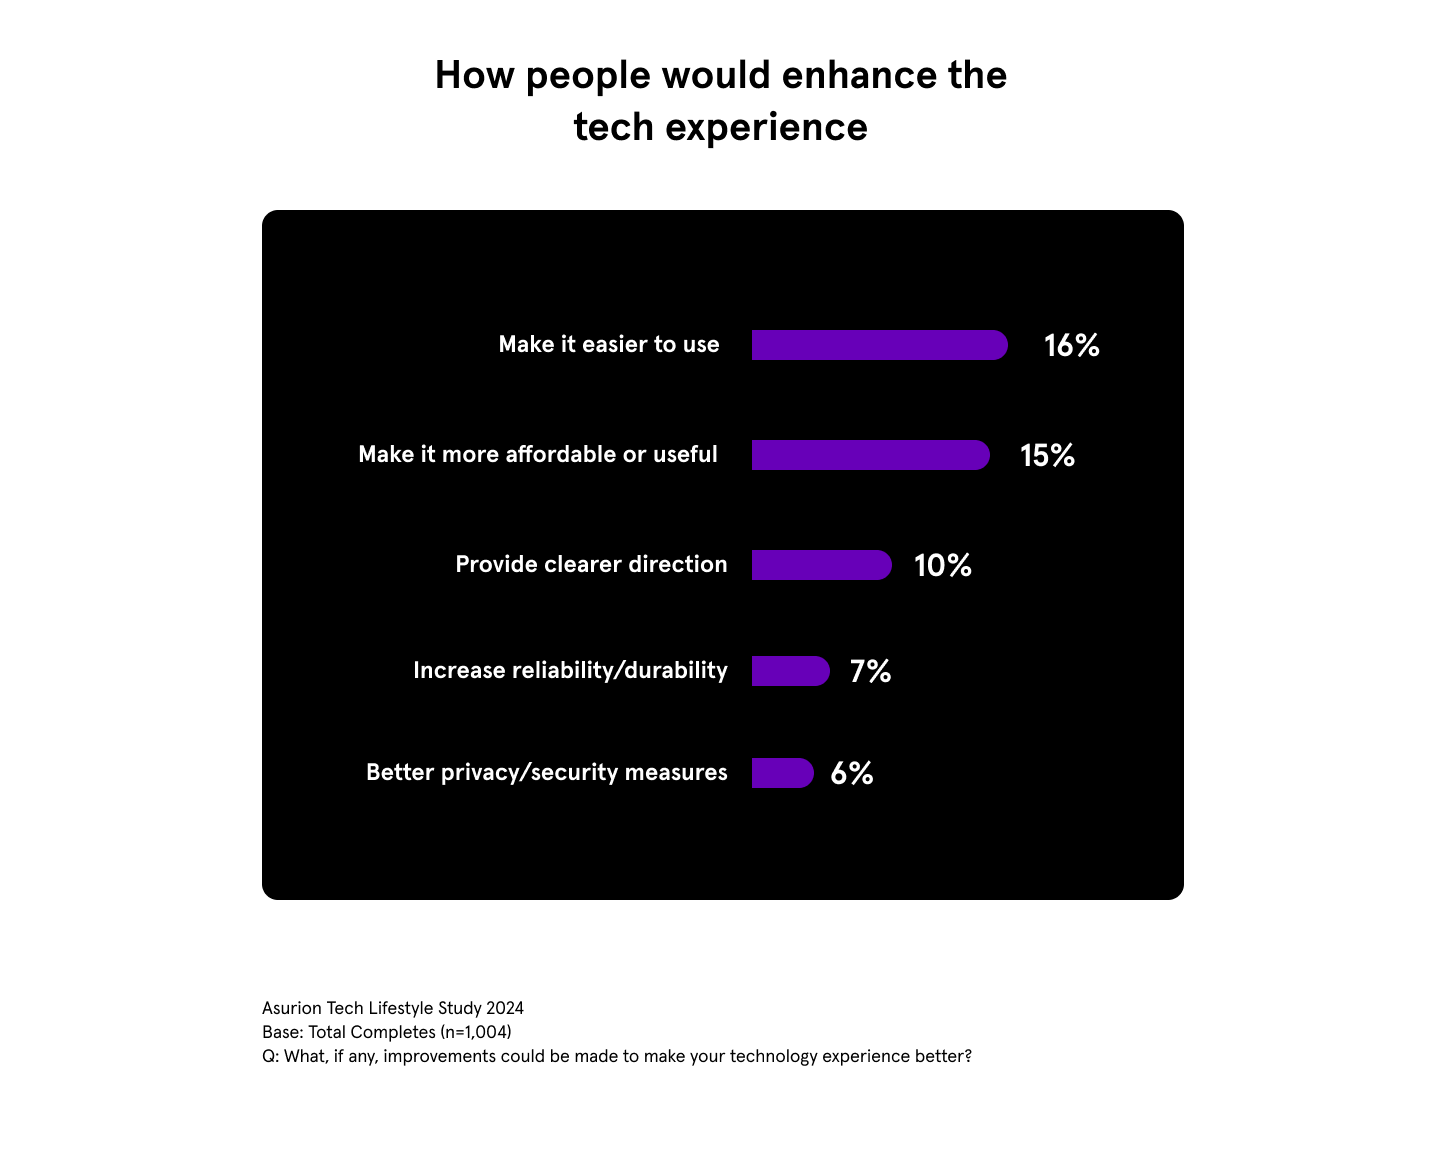
How people enhance the tech experience. 16% make it easier to use, 15% make it more affordable, 10% provide clearer direction, 7% increase reliability/durability, 6% better privacy/security measures

Making tech work better for all

If we could improve the overall tech experience, many people say they’d want to simplify technology and make it more affordable, valuable, and useful. They’d also want clearer instructions, increased reliability and durability, and better security and privacy measures.

A tablet being held while the user sits

Where people go for answers

The majority of people use Google® search when they need help with technology (cited by 60% of respondents), but many also prefer tutorials on YouTube® (55%). Here’s the breakdown:

  • Significantly more men than women have searched for a YouTube video to solve a tech problem (60% vs. 52%).
  • Far more Gen Zers search YouTube than Boomers (62% vs. 45%).
  • More people with kids watch YouTube than without (66% vs. 51%).
  • More tech-savvy people than not use YouTube (66% vs. 49%).